SDK.finance system performance testing
Updated on 15 Apr 2024
The SDK.finance system workload capacity is 2700 Transactions Per Second (TPS)
SDK.finance conducted performance testing to define workload capacity and run a Transactions Per Second (TPS) assessment, with the following configuration.
Hardware configuration
- PostgreSQL Server (x1): Intel Xeon Gold 5412U CPU, 256 GB DDR5 RAM, 2x 1.92 TB NVMe SSD Storage (RAID 1)
- MongoDB Server (x1): 8 vCPU, 32 GB RAM, 240 GB NVMe SSD Storage
- App Instances (3-5): 8 vCPU, 16 GB RAM, 240 GB NVMe SSD Storage (Java 17)
- JMeter Farm (1-5): 4 vCPU, 8 GB RAM, 160 GB NVMe SSD Storage (v. 5.6.3)
Test plan
- Creation of 7 million simulated users with EUR accounts and initial funds.
- Configuration of transfer limits and commissions.
- System snapshot generation (PostgreSQL database).
- Simulated user load testing with 500 concurrent connections (incremental steps of 100 users, 10-second ramp-up, 5-minute duration per step).
- Random user login and security token acquisition.
- 100 random account transfers per user.
- Result screenshots for documentation.
- Database restoration from snapshot.
- Application parameter adjustments and restart for subsequent tests.
- Execution of additional test scenarios (details omitted for brevity).
Outcome
The testing provided valuable insights into system scalability and performance characteristics, ensuring a robust and efficient platform for user demands.
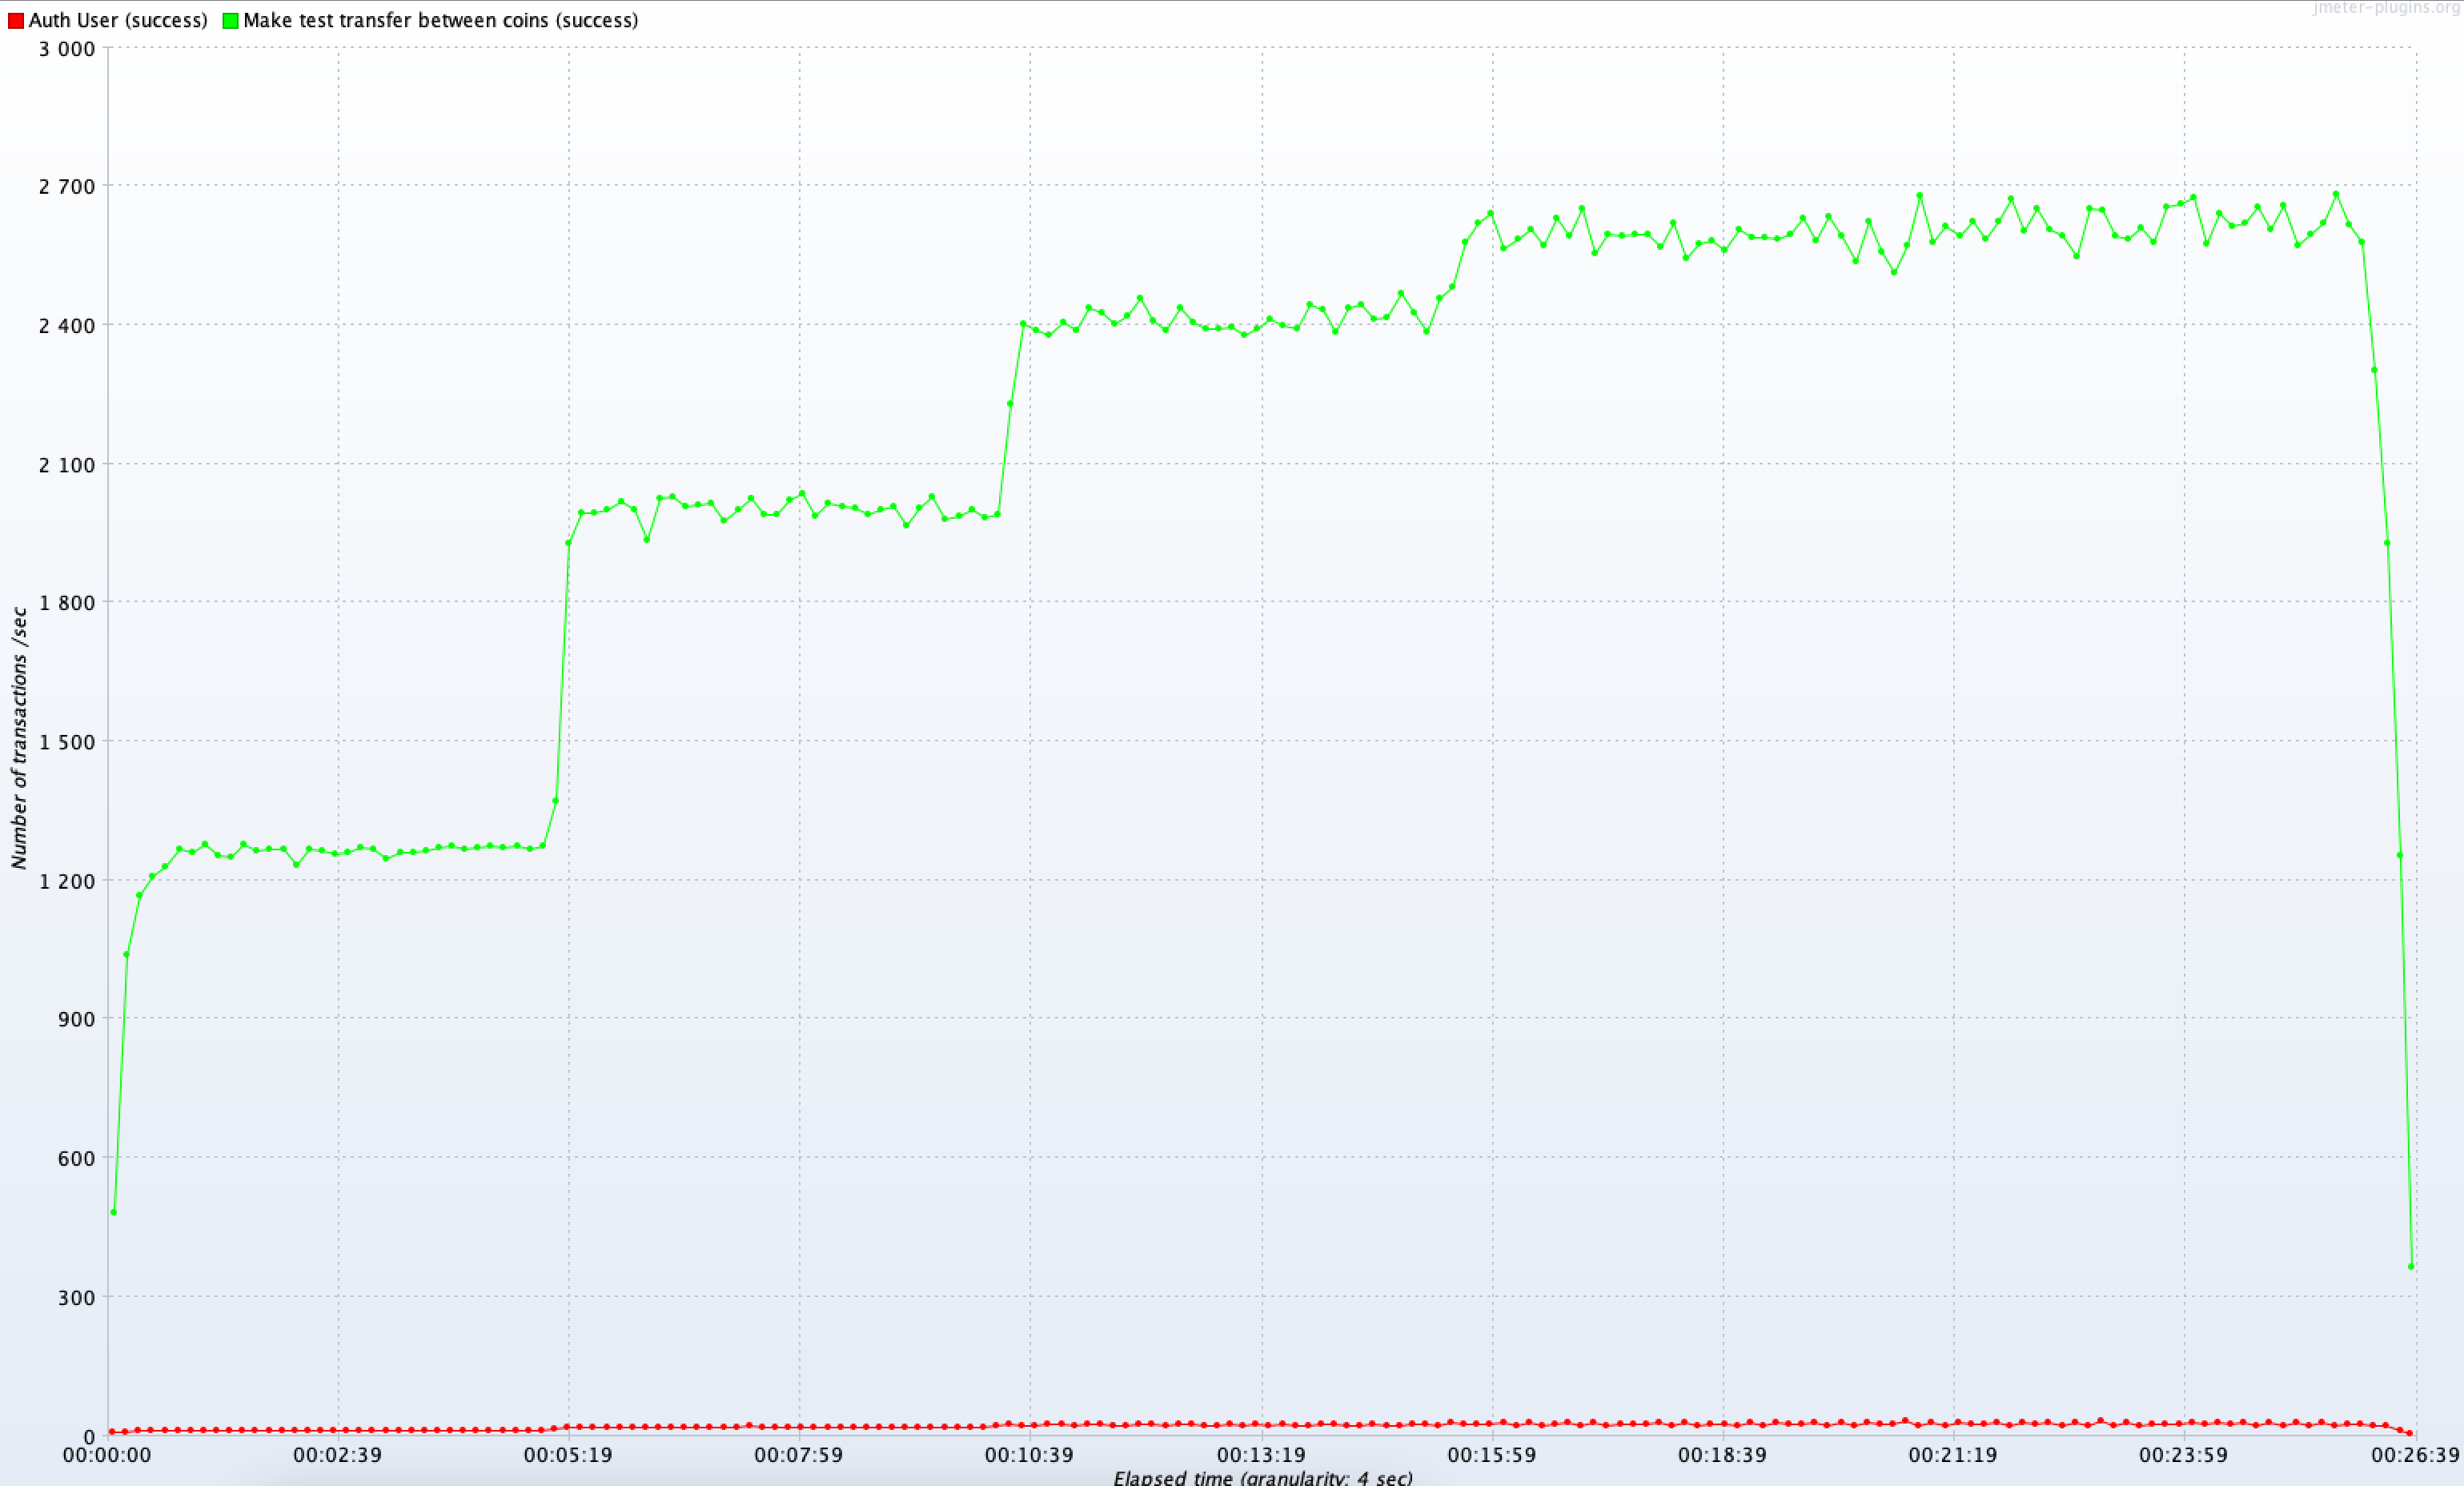
Pic.1. Transactions per second